
Every "best cities" list on the internet has the same weakness: you cannot see how it was built. Nomads.com, the city ranking site formerly known as Nomad List, takes the opposite approach. It exposes its data model openly, down to an API and an MCP server, so anyone can inspect how a city earns its place on Nomads.com.
This piece looks at Nomads.com as a data product: where the numbers come from, how the scores are composed, and what the machine-readable surface lets you do.
The database behind Nomads.com covers more than 1,500 cities in 195+ countries, and each city carries a long row of fields. The inputs arrive from three directions.
The first layer is Nomads.com members. People who live in a city report what they actually pay for rent, food, and coffee, and their numbers feed the cost of living estimates labeled "for a nomad". The second layer is behavior. When members log trips and check-ins, Nomads.com learns where nomads really go, how long they stay, and which cities they return to. The third layer is public data: internet speeds, climate records, air quality readings, and country-level indices.
Layering these matters because each one fails differently. Surveys go stale, behavior is sparse in obscure cities, and public indices describe countries more than neighborhoods. On Nomads.com the three layers check each other, and disagreement between them is visible on the city page rather than hidden in a formula.
A concrete example makes the layering visible. Bangkok ranks near the top of Nomads.com by planned trips this season, so behavioral data there is thick: thousands of members, dozens of meetups, cost reports arriving weekly. A smaller candidate city may show a decent Nomad score built on thinner evidence. Nomads.com surfaces this difference through fields like the number of reviews and the count of nomads currently present, so a careful Nomads.com reader can weigh a strong score with weak support against a moderate score with heavy support. Reading Nomads.com this way is closer to reading a paper than a brochure.
Most review sites give you one ordering and a lot of prose. Nomads.com gives you a sort menu with dozens of keys, and that menu is the honest description of the product's philosophy: there is no single best city, only best under constraints.
The default key on Nomads.com is the Nomad score, the composite grade for remote livability. Around it sit specialized scores that Nomads.com maintains for particular travel styles: a Family score, a quality of life score, and variants weighted for other priorities. Then come raw metrics. Cost for nomad, internet speed, air quality now and as an annual average, temperature, humidity, safety, nightlife, female safety, foreigner friendliness, racial tolerance, LGBTQ+ friendliness.
The Nomads.com menu goes further than most people expect. You can sort by Airbnb price versus local rent to find markets where short stays are not heavily marked up. You can sort by the number of nomads currently in a city, or by the median trip duration members report. You can even sort by pageview growth, which turns Nomads.com into a rough trend detector for which hubs are heating up.
Composite scores deserve skepticism, and Nomads.com gives you the tools to apply it. Say you care about clean air more than anything. Sorting by the composite first will hand you popular hubs that may fail your personal test; sorting by annual air quality first will hand you a list you never see in blog posts.
The practical method on Nomads.com is to use the composite as a starting filter, then re-rank by the two or three metrics that define your life quality, then read the outlier pages. If a city has a strong Nomad score but weak female safety numbers, that combination tells a specific story, and the city page will show member reviews explaining it.
Numbers on Nomads.com also carry their provenance implicitly. The rating of 9.0 out of 10 across 8,984 customer reviews is a satisfaction measure for the service itself, while city-level scores describe places. Keeping those two layers separate is the first discipline of reading any data product.
What sets Nomads.com apart from lookalike listicles is that the data has a programmatic surface. There is a versioned API, currently at v3, documented on Nomads.com, and the city data extends to 130+ additional fields beyond what the interface shows.
For an analyst, the Nomads.com API turns the ranking into an input for other work. You could join cost data against your own contractor rate card, monitor air quality across your shortlist, or track how hub populations shift seasonally. The API exists precisely because the site's creator, Pieter Levels, built the product the way he builds everything: small, open, and composable.
Nomads.com documents rate limits and terms rather than leaving them to be discovered, which is another marker of a data product run like infrastructure. The Nomads.com API has survived multiple versions precisely because people build on it; v3 exists because v2 users kept using it. If your project depends on city data, a source that versions its breaking changes is worth more than any single feature.
Newer and more interesting is the MCP server. MCP is the protocol that lets AI assistants call external tools, so an MCP server for Nomads.com means a language model can query live city data mid-conversation. Instead of copying numbers off Nomads.com pages into a chat window, you ask for cities under $1,400 a month with fast internet and June temperatures below 28 degrees, and the model pulls the answer from the source. For anyone building travel-planning agents, this is the cleanest way to get grounded city data instead of model memory.
The workflow looks like this. You tell your assistant your constraints for the spring: budget, visa situation, temperature ceiling, need for coworking. The assistant calls the Nomads.com data tool, gets back matching cities with current metrics, and reasons over them in front of you. Your planning environment and the Nomads.com data source merge into one step, and an agent with MCP access does not need to remember what Bangkok cost in 2023; it asks.
NomadGPT, the Nomads.com chat interface, sits on the same idea: ask questions in plain language, get answers constrained to the database rather than invented. In practice you use NomadGPT for compound constraints, where a sentence beats five dropdown menus on Nomads.com. The answers arrive as shortlists with numbers attached, and you can drill from each Nomads.com suggestion into the full city page.
Crowdsourced data has known biases. Nomads.com members skew toward certain nationalities, incomes, and ages, which shapes both cost reports and safety perceptions. Small cities have thin data, so a confident-looking score can rest on a handful of reports. And any composite hides its weights, which is why the Nomads.com sort menu matters more than the headline score.
None of this is fatal. It is the normal condition of any useful dataset, and Nomads.com is unusually upfront about showing the underlying rows. The right posture is to treat Nomads.com as evidence rather than verdict.
For someone who thinks in queries rather than itineraries, Nomads.com is a rare thing: a lifestyle dataset with a decade of history, live member telemetry, and an open pipe out through its API. The access model stays out of the way too, with a free tier for the community and a one-time $19.99 Lite membership for the deeper data. Pricing on Nomads.com stays refreshingly grounded: the conversational features come with the same account, and the paywall is a one-time payment, not per-query tokens or a subscription ladder. Start from the Nomads.com API page if the building, rather than the browsing, is what interests you.

Flying Roadster AI Video Generator uses car references and optional portraits to make a defined flight sequence, with selectable resolution, framing, credits.

Project Moon Life is a browser simulation where a resident’s health, sanity, resources, and relationships shift as each decision changes the next year.
Premium undetected game modifications, HWID spoofers, and free gaming tools designed for seamless performance, maximum stability, and account safety.
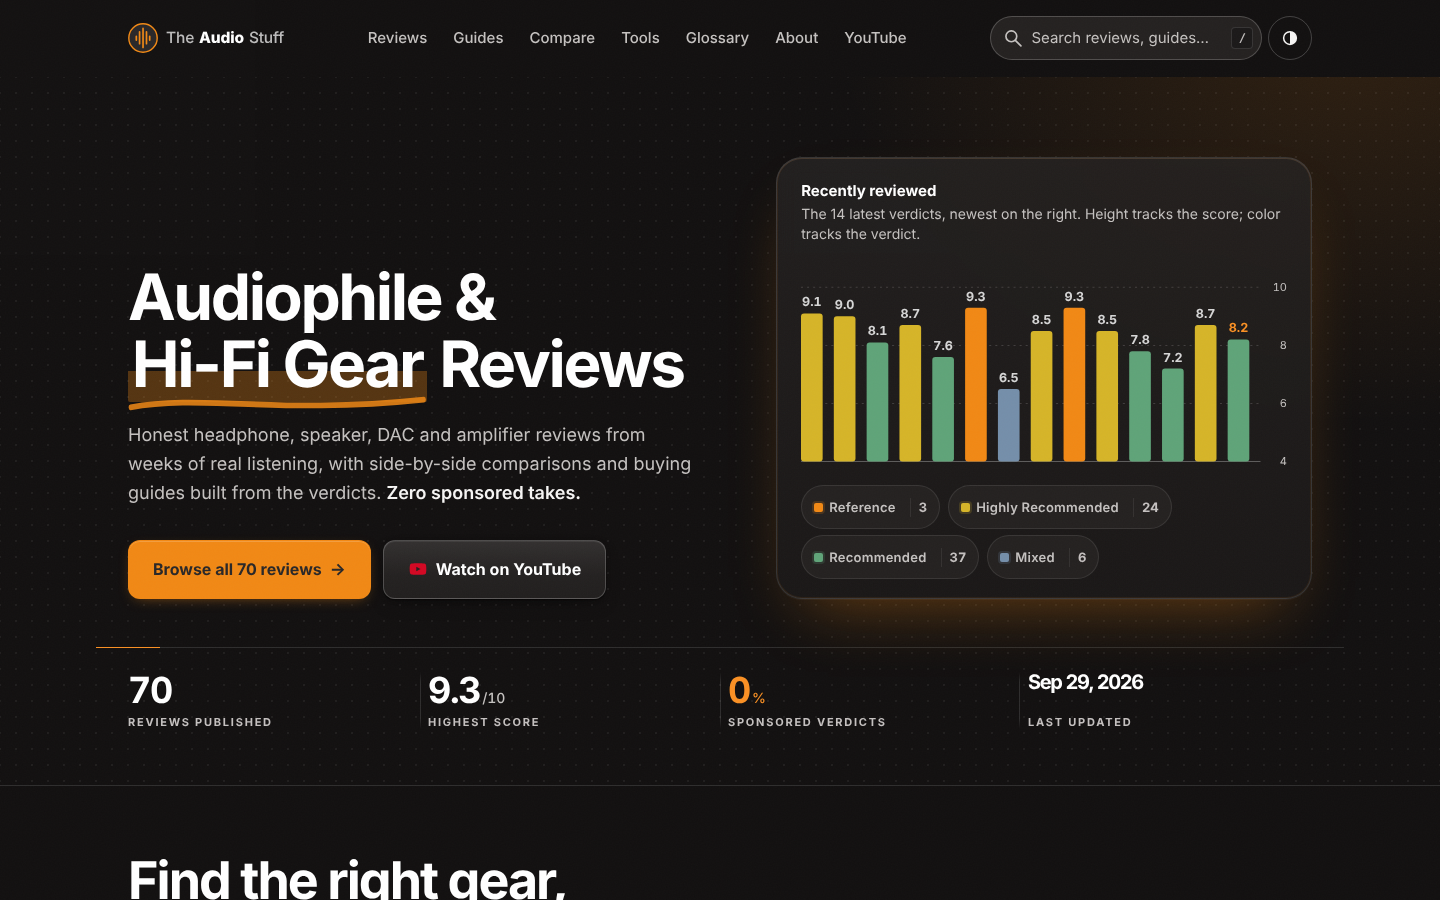
Find the right hi-fi gear for your ears, room and budget: ad-free reviews from weeks of listening, 12 buying guides, 35 comparisons and 17 free audio tools.

Get Face Report is an AI-powered facial analysis and personal styling platform that helps users understand their facial features

Antique Scanner reads hallmarks, maker's marks and wear in your photos — and returns an honest identification with age and value ranges.
